Last year Soundscan was rebranded as Nielsen Music. Whatever, I’m still going to call it Soundscan. I’m a fogey like that.
2015 was the year that streaming really took off. Apple finally got into it after acquiring Beats, which had acquired my beloved MOG. Apple Music still kinda sucks, but I renewed my subscription after my three month free preview ran out. I’ve gotten my money’s worth by downloading all those Velvet Underground box sets and a bunch of other stuff. Some of it I probably would have bought, some of it I probably wouldn’t have.
My favorite albums of the year were Courtney Barnett’s Sometimes I Sit and Think, and Sometimes I Just Sit, Father John Misty’s I Love You, Honeybear, and Sufjan Stevens’ Carrie & Lowell. I also liked Craig Finn’s Faith In the Future, Jason Isbell’s Something More Than Free, Kacey Musgraves’ Pageant Material, the Mountain Goats’ Beat the Champ, Wilco’s Star Wars, and I’m happy the Libertines got their shit together enough to pull off Anthems for Doomed Youth.
But the biggest story of 2015 was Adele who proved that there are still a bunch of people out there who are willing to pay for an album. Billboard’s Ed Christman points out, “By herself, Adele accounted for three percent of total album sales in the U.S.” Which is insane. 25 sold 7.44 million copies. That would have been bonkers in any year, but it’s especially crazy in these days of cultural fragmentation.
Anyway, here’s the data…
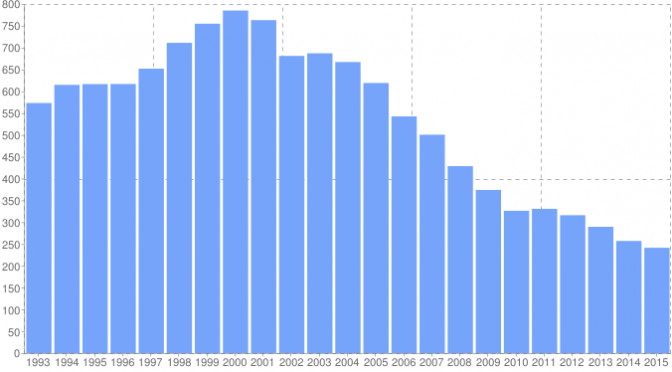
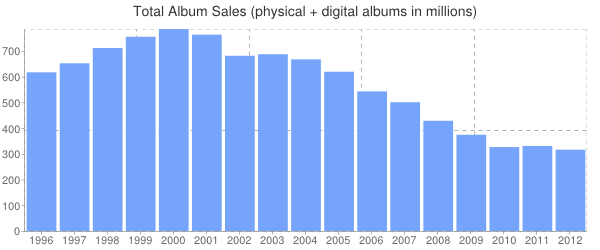
Total Album Sales (physical + digital albums)
2015: 241.39 million
2014: 257.02 million
2013: 289.41 million
2012: 315.96 million
2011: 330.57 million
2010: 326.15 million
2009: 373.9 million
2008: 428.4 million
2007: 500.5 million
2006: 542.4 588.2 million [Corrected 10/30/2017. -ed.]
2005: 618.9 million
2004: 667 million
2003: 687 million
2002: 681 million
2001: 763 million
2000: 785 million
1999: 754.8 million
1998: 711 million
1997: 651.8 million
1996: 616.6 million
1995: 616.4 million (I’ve heard the figure is 616,957,000)
1994: 614.7 million (I’ve heard the figure is 615,266,000)
1993: ~573 million (1994 was 7.4% increase over 1993)
Continue reading 2015 Soundscan Data: Total Music Sales and Consumption


 Total Album Sales (physical + digital albums)