So it looks like fewer and fewer people care about owning their music. This is the first year that I didn’t buy a single new release on compact disc (although I picked up a few deluxe reissues on CD). I bought a bunch of vinyl including Father John Misty’s Pure Comedy, the Mountain Goats’ Goths, Jason Isbell’s The Nashville Sound, Neil Young’s Hitchhiker, and the Replacements’ Live at Maxwell’s.
But most of the new stuff I listened to this year was streamed including tons of miscellaneous singles as well as new albums by Spoon, Conor Oberst, Aimee Mann, Strand of Oaks, Diet Cig, Lorde, Micah Schnabel, Tristen, Courtney Barnett & Kurt Vile, St. Vincent, Last Leaves, Taylor Swift, and my absolute favorite album of the year: Feel Your Feelings, Fool by the Regrettes. I’ll pick that stuff up on vinyl if I see a deal, but I’m in no hurry. Patience is a virtue, after all.
I’m apparently not alone. Music sales are down down down. But streaming is way up and if you accept the industry’s argument that 1,500 streams is equivalent to one album sale then things are about the same as they were in the early- to mid-90s, before the brief, turn-of-the-century bubble. So maybe all’s well. Who knows?
Seems like only yesterday that we were all celebrating the certain death of the major label system, but just like everything else about the early internet age, we were overly optimistic and grossly naive about the resilience of corporate America. So it goes. Anyway, here’s the data…
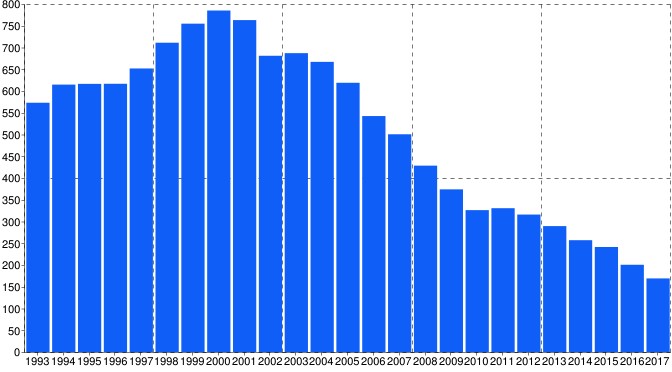
Total Album Sales (physical + digital albums)
2017: 169.15 million
2016: 205.5 million
2015: 241.39 million
2014: 257.02 million
2013: 289.41 million
2012: 315.96 million
2011: 330.57 million
2010: 326.15 million
2009: 373.9 million
2008: 428.4 million
2007: 500.5 million
2006: 588.2 million
2005: 618.9 million
2004: 666.7 million
2003: 667.9 million
2002: 693.1 million
2001: 762.8 million
2000: 785 million
1999: 754.8 million
1998: 712.5 million
1997: 651.8 million
1996: 616.6 million
1995: 616.4 million (I’ve heard the figure is 616,957,000)
1994: 614.7 million (I’ve heard the figure is 615,266,000)
1993: ~573 million (1994 was 7.4% increase over 1993)
Compact Discs
2017: 88.2 million
2016: 104.8 million
2015: 125.6 million
2014: 140.9 million
2013: 165.4 million
2012: 193.4 million
2011: 223.5 million
2010: 239.9 million
2009: 294.9 million
2008: 360.6 million
2007: 449.2 million
2006: 553.4 million
2005: 598.9 million
2004: 651.1 million
2003: 635.8 million
2002: 649.5 million
2001: 712.0 million
2000: 730.0 million
1999: 648.1 million
1998: ~578 million
1997: 504.6 million
1996: 448.4 million
1995: 368 million
Digital Albums
2017: 66.2 million
2016: 82.3 million
2015: 103.33 million
2014: 106.47 million
2013: 117.58 million
2012: 117.68 million
2011: 103.1 million
2010: 86.3 million
2009: 76.4 million
2008: 65.8 million
2007: 50 million
2006: 32.6 million
2005: 16.2 million
2004: 5.5 million
Vinyl albums
2017: 14.32 million
2016: 13.1 million
2015: 11.92 million
2014: 9.19 million
2013: 6.1 million
2012: 4.55 million
2011: 3.9 million
2010: 2.8 million
2009: 2.5 million
2008: 1,877,000
2007: 990,000
2006: 858,000
2005: 857,000
2004: 1,187,000
2003: 1,404,000
2002: 1,339,000
2001: 1,246,000
2000: 1,533,000
1999: 1,405,000
1998: 1,376,000
1997: 1,092,000
1996: 1,145,000
1995: 794,000
1994: 625,000
Cassette albums
2017: 174,000 source
2016: 129,000 source
2015: 74,000 source
2014:
2013:
2012:
2011: 31,000
2010: 21,000
2009: 34,000
2008: ~82,000 source
2007: 274,000
2006: ~1.128 million source
2005: ~2.667 million source
2004: 8.6 million
2003: 17.9 million
2002: 29.8 million
2001: 49.4 million
2000: 77.2 million
1999: 105.5 million
1998: ~130.8 million
1997: 146 million
1996: 166.7 million
Digital track sales
2017: 554.82 million
2016: 724.0 million
2015: 964.76 million
2014: 1.1 billion
2013: 1.26 billion
2012: 1.336 billion
2011: 1.27 billion
2010: 1.17 billion
2009: 1.16 billion
2008: 1.07 billion
2007: 844.1 million
2006: 582 million
2005: 352.7 million
2004: 142.6 million
2003: 19.2 million (SoundScan monitored them only during the year’s second half)
Song Streams *
2017: 618.03 billion (400.38 billion were audio-only)
2016: 432.2 billion (252.3 billion were audio-only)
2015: 317.2 billion (144.9 billion were audio-only)
2014: 164.5 billion
2013: 118.1 billion
2012: ~89.5 billion (calculated on reports that 2013 was up 32%)
* Non-interactive digital services like Pandora and Sirius XM are not included in the streams tracked by Nielsen Music.
Total Album Consumption Units (Album Sales + TEA + SEA)
2017: 636.65 million
2016: 566.1 million
2015: 549.35 million
2014: 476.93 million
2013: 486.1 million
* One track equivalent album (TEA) unit is equal to 10 tracks sold. “The industry calculates that a stream equivalent album (SEA) equals 1,500 streams. (That’s an average payout of half a cent per stream, totaling $7.50. In 2013, the average payout per stream was $.0.00375, thus in that year 2,000 streams equaled one SEA unit.)” – Ed Christman.
Album Consumption Historical Comparison *
2017: 636.65 million
2016: 566.1 million
2015: 549.35 million
2014: 476.93 million
2013: 486.1 million
2012: 449.5 million
2011: 457.7 million
2010: 443.4 million
2009: 489.8 million
2008: 535.4 million
2007: 585 million
2006: 646.3 million
2005: 654.1 million
2004: 680.7 million
2003: 687 million
2002: 681 million
2001: 763 million
2000: 785 million
1999: 754.8 million
1998: 711 million
1997: 651.8 million
1996: 616.6 million
1995: 616.4 million
1994: 614.7 million
1993: ~573 million
* I made this one up to try to compare the different ways people have accessed music since the beginning of the Soundscan era. From 1993 to 2003, we just use album sales. From 2004 to 2012, we use album sales + TEA to account for track downloads. From 2013 to present, we use album sales + TEA + SEA. This gives a somewhat relative comparison to how much music people are “consuming” over the years, and it doesn’t look nearly as dreary as comparing actual album sales…
Sources: 2017 (overview, vinyl, consumption, streams, sales, Nielsen), Billboard, Business Wire, Billboard, New York Times, Billboard, Billboard, Nielsen Music, Billboard, Billboard, Billboard, USA Today, Billboard, Billboard, Billboard, Billboard, Billboard, Billboard, Billboard, Billboard, USA Today, Computer World, New York Times, Hollywood Reporter, CTV, BBC, WSJ, Billboard, Billboard, Billboard, Billboard, Billboard, Billboard, Pitchfork, Narm, Billboard.
We’ve been doing this for a while. See our previous annual sales wrap-ups: 2016, 2015, 2014, 2013, 2012, 2011, 2010, 2009.